



 10 minutes to read
2026-08-18
Rami Salah
How to Read the Alligator Indicator and Spot Chart Patterns


Some indicators sound complicated before you even look at them. The Alligator is one of the easier ones — three colored lines named after an alligator's jaw, teeth, and lips, built to show you when the market is asleep and when it's ready to move. Pair that with a handful of classic chart patterns, and you've got a way to read price action that doesn't require a finance degree, just a bit of practice.
In this article, we’ll look at what the Alligator indicator is, how to read it step by step, and which chart patterns are worth knowing. We’ll also look at how the two can work together to build a trading signal, along with some common mistakes to avoid while you’re getting started.
What Is the Alligator Indicator?
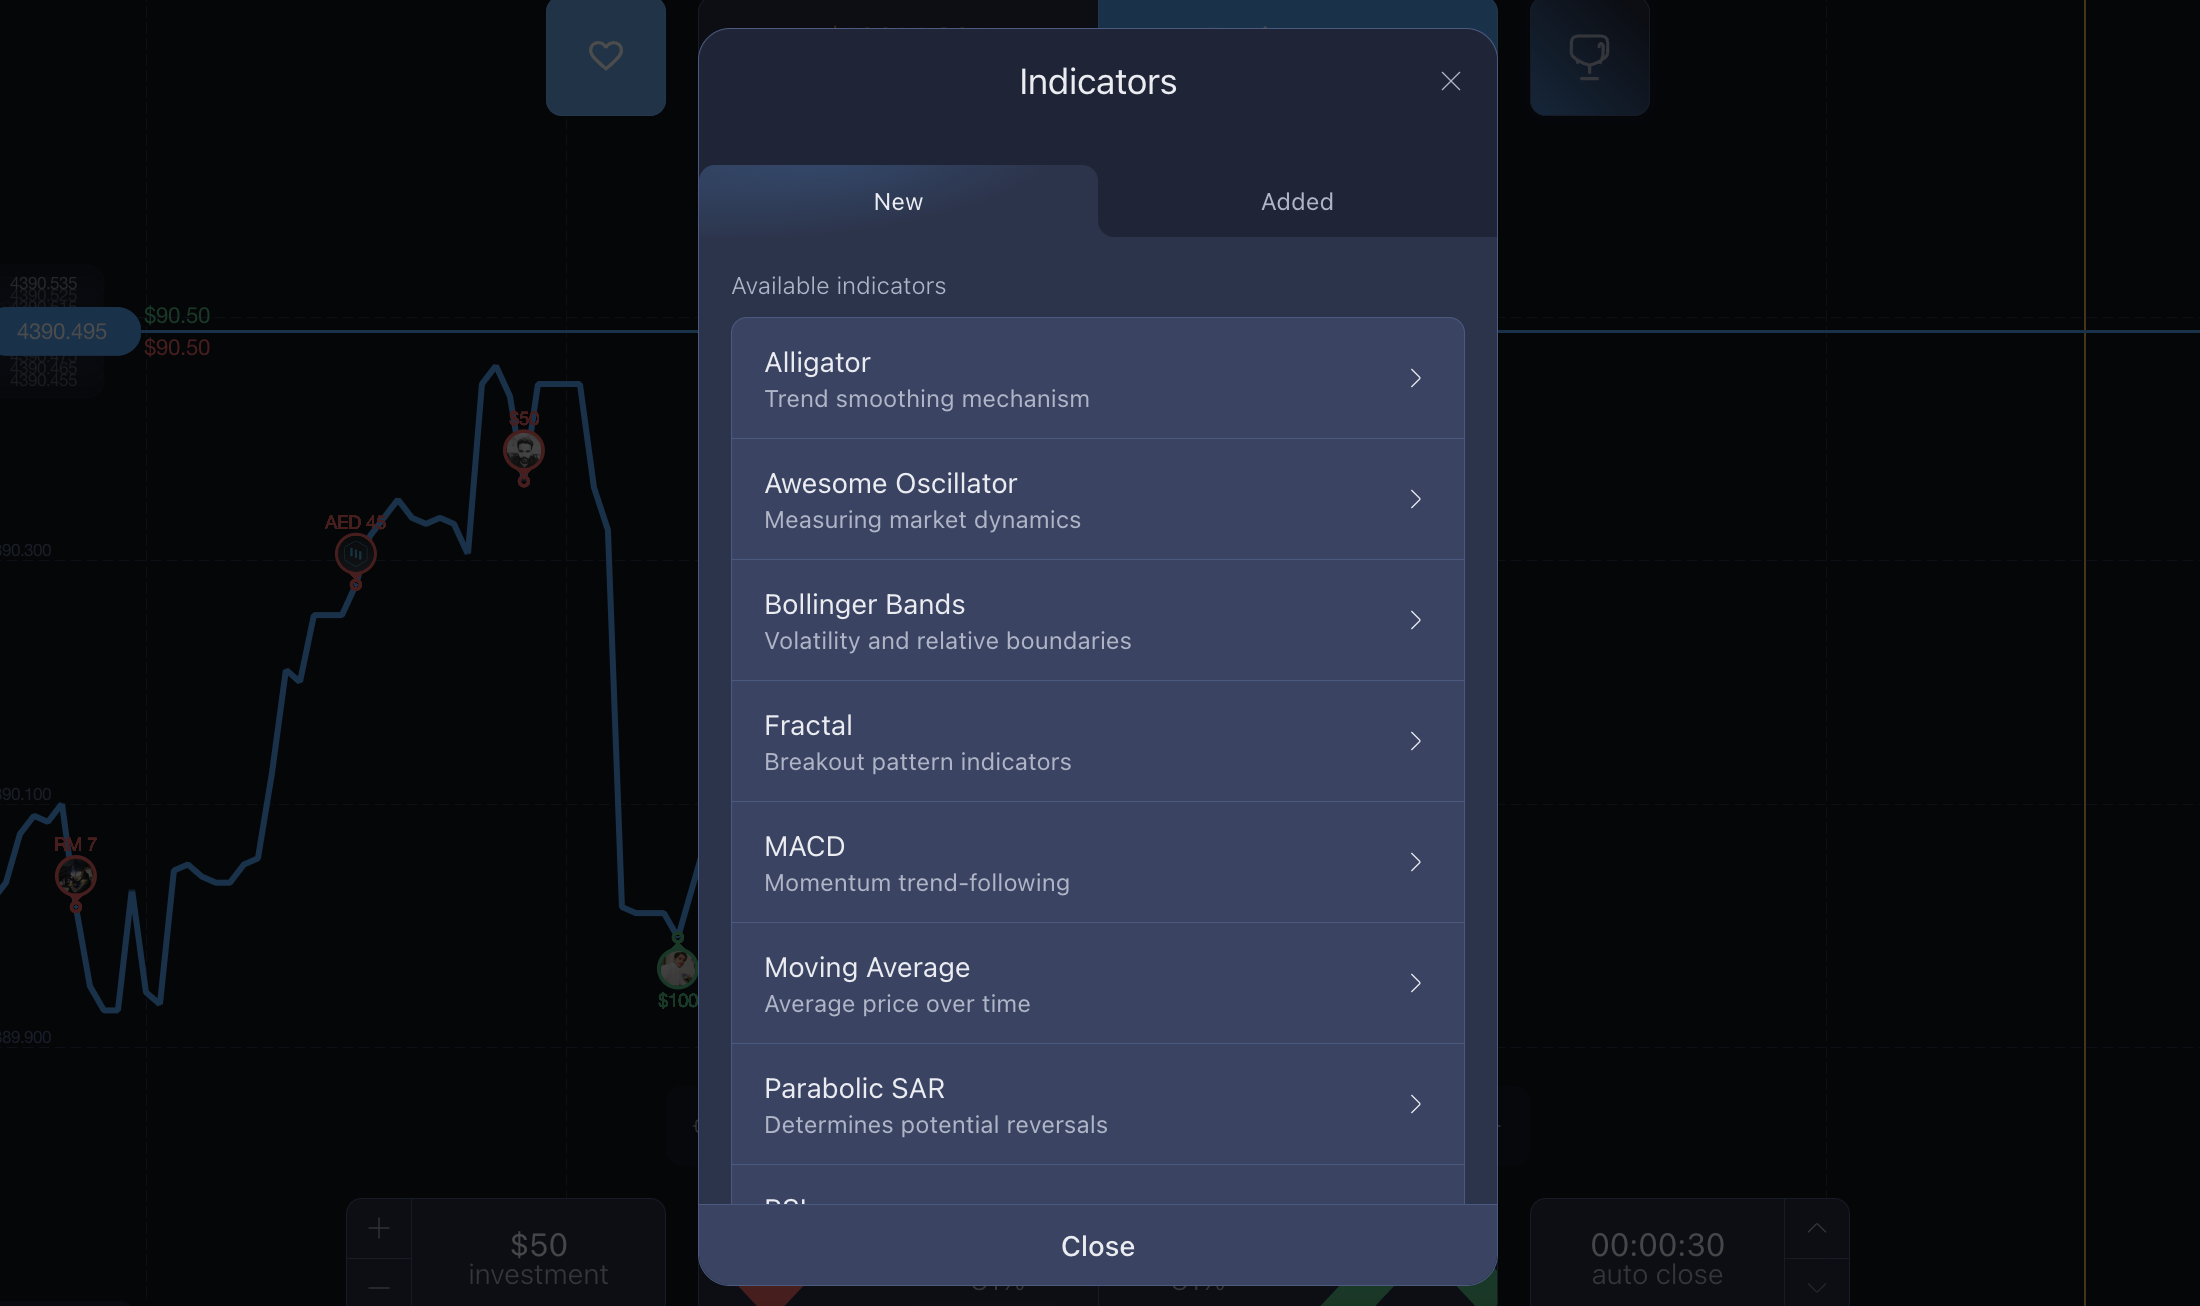
Developed by trader Bill Williams, the Alligator indicator does exactly what its name suggests: it helps identify when the market is “sleeping” and moving sideways, and when it’s “waking up” as a new trend begins to form. The indicator uses three moving averages overlaid on the price chart, each shifted slightly forward to make it easier to spot when they begin to spread apart as a trend develops.
How the Alligator Indicator's Three Lines Work
The three lines each represent a different part of the alligator, and each one moves at a different speed:
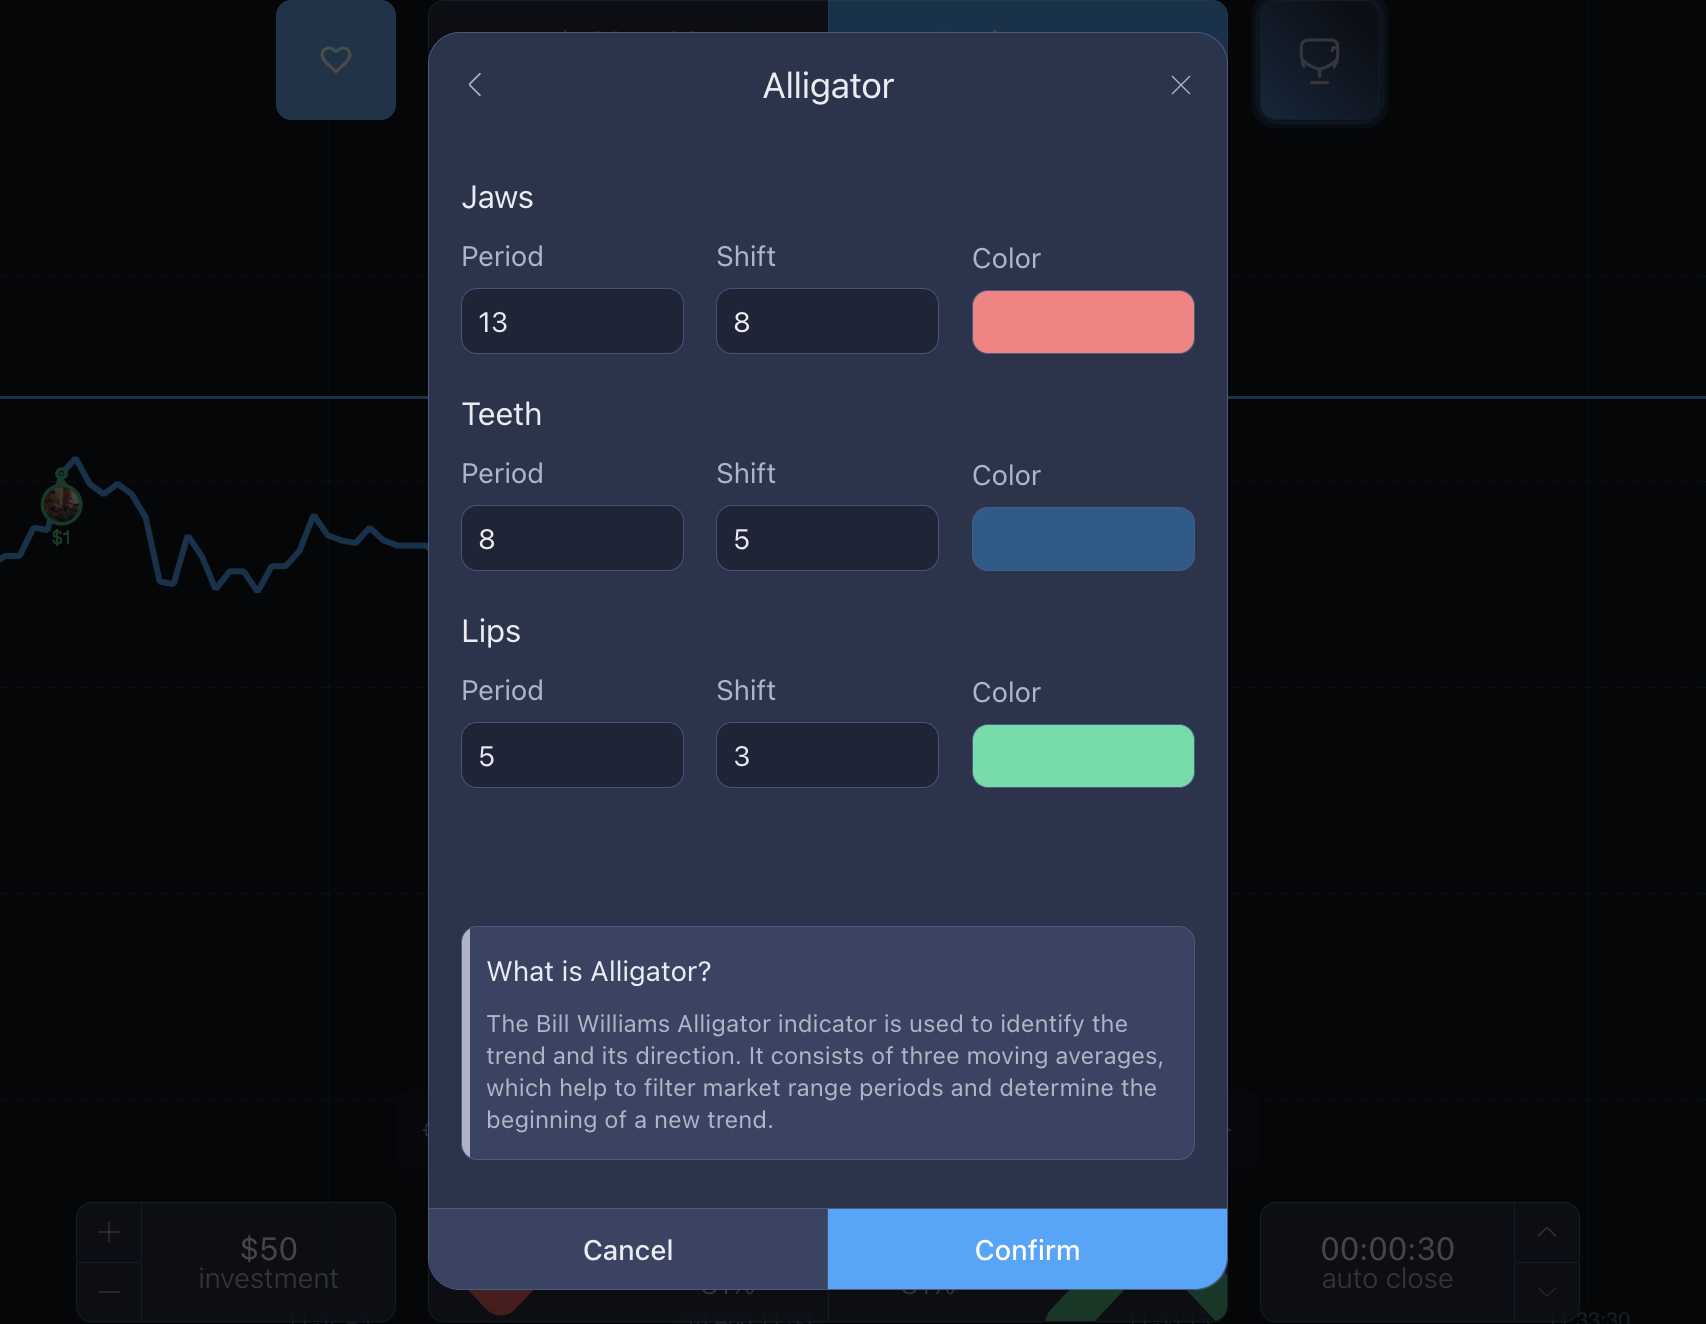
- Jaw (blue line) — the slowest-moving line, based on a 13-period average.
- Teeth (red line) — a medium-speed line, based on an 8-period average.
- Lips (green line) — the fastest-moving line, based on a 5-period average.
When the three lines are tangled together, the Alligator is “asleep,” usually signalling a market that’s moving sideways without a clear direction. As the lines start to spread apart and move in the same direction, the Alligator is “waking up,” suggesting that a trend may be taking shape. In an uptrend, the green line moves above the others; in a downtrend, it drops below them, with the red and blue lines following.
How to Read the Alligator Indicator Step By Step
Here's a simple way to read the alligator indicator without getting lost in the three lines:
- Add the indicator to your chart. On most platforms, including ExpertOption, you can add it with a few clicks, and the three lines will appear over the price chart.
- Check whether the lines are tangled or separated. Tangled means the market is usually moving sideways. When they spread apart, a trend may be developing.
- Look at the order of the lines. In an uptrend, the green lips are above the red teeth, with the blue jaw below them. In a downtrend, the order is reversed, with the blue jaw on top.
- Watch the price relative to the lines. Price above all three lines generally supports an uptrend, while price below all three can support a downtrend.
- Note how wide the gap is. A widening gap between the lines usually means the trend is gaining strength; a narrowing gap can be an early sign it's losing steam.
Spotting a Trending vs. Sleeping "Alligator"
The easiest way to tell the two states apart is to check how the three lines are positioned. When the Alligator is “sleeping,” the lines are bunched closely together and constantly cross, which usually means the market doesn’t have a clear direction. This can make entries less reliable. When the Alligator is “hunting,” the lines spread out and move in the same direction, suggesting a stronger trend and a potentially better environment for finding trading opportunities.
Common Chart Patterns Every Trader Should Recognize
Along with indicators like the Alligator, these are some of the key patterns worth knowing:
- Head and shoulders — three peaks, with the middle one higher than the others. It can signal a possible trend reversal.
- Double top and double bottom — two peaks or troughs around the same price level, which can suggest that the market is struggling to move past that level.
- Triangles — price moves within an increasingly narrow range, often before a breakout.
- Flags and pennants — short pauses during a strong trend that can be followed by a move in the same direction.
- Engulfing candles — a two-candle pattern where the second candle’s body covers the first, which can signal a change in momentum.
Recognizing these chart patterns takes some practice, but once you know what to look for, they can become a quick and easy way to read a chart at a glance.
Trend Continuation vs. Reversal Chart Patterns
It helps to divide these patterns into two main categories. Continuation patterns, such as flags, pennants, and triangles, typically appear during an existing trend and suggest that the current price movement may resume after a brief pause. Reversal patterns, including head and shoulders, double tops, and double bottoms, suggest a possible shift in direction as the current trend loses momentum.
Understanding which type of pattern you’re looking at can help determine how to interpret the potential next move.
Combining the Alligator Indicator With Chart Patterns
On its own, a chart pattern shows you what price has been doing, while the Alligator helps you assess whether the broader trend supports the pattern. Using them together can give you more context and help filter out some market noise.
The key is to look for agreement between the two. If a chart pattern points in one direction while the Alligator shows a trend in the same direction, the setup may carry more weight than either signal alone.
From Indicators to Trading Signals
An indicator on its own provides information, but a trading signal is what helps turn that information into a potential action: buying, selling, or waiting.
How the Alligator Indicator and Chart Patterns Can Generate a Trading Signal
One approach is to wait for the Alligator to show a clear trend, with its lines spread out and moving in the same direction. Then look for a chart pattern that supports the trend.
For example, a bullish continuation pattern alongside an upward-trending Alligator may support the idea that the uptrend could continue. If a reversal pattern appears as the Alligator’s lines start coming together, it may suggest that the trend is losing momentum.
Using Expert Option Signals Responsibly As Part of Your Analysis
ExpertOption also has a built-in Trends tool that shows the current buy or sell sentiment based on the platform's own analysis, which some traders use alongside their own chart reading. These expert option signals can provide another useful point of reference.
Still, it’s best to treat them as one piece of the puzzle rather than relying on them alone. Ideally, the platform’s signal should line up with what you’re seeing on the chart — for example, when the Alligator and a chart pattern point in the same direction.
Common Mistakes When Reading Indicators and Patterns
A few habits show up again and again among traders still getting comfortable with this type of analysis:
- Trading while the alligator is asleep. Entering trades when the three lines are still tangled together usually means trading a market with no real direction, which tends to produce choppy, unreliable results.
- Spotting a pattern too early. Chart patterns need to complete before they mean much. Jumping in on what looks like a head and shoulders or a triangle before it's finished forming is a common way to get caught out.
- Ignoring the broader trend. A chart pattern that contradicts what the Alligator is showing calls for caution, not a reason to ignore the indicator.
- Relying on one signal alone. Whether it's a single chart pattern, the Alligator by itself, or an expert option signal, leaning on just one piece of evidence tends to produce weaker results than combining a few.
- Skipping practice. Reading indicators and patterns is a skill that takes repetition. Trading live before you've had a chance to practice usually means learning these lessons the expensive way.
Final Thoughts
Once you get the hang of them, the Alligator indicator and chart patterns are fairly easy to understand. The Alligator helps you see whether the market is moving in a clear trend or taking a breather, while chart patterns can give you clues about where price might go next. Neither one is reliable enough to use on its own, and there are no guarantees when it comes to trading. Used together with other confirmation signals, though, they can give you a clearer picture of what’s happening in the market before you decide whether to enter a trade. Like any trading technique, they take practice, so spend some time watching how the Alligator moves between its “sleeping” and “awake” phases and how different patterns play out before putting real money on the line.
Latest Posts
Trading Education
Trading News
Trading Strategies
Promotions & Tournaments
Success Stories & Tips
Platform Updates
Global events, stocks, crypto, forex
ExpertOption Reviews: An Honest Overview and Tips from Traders
5 minutes to readExpertOption Withdrawal Policy: How Withdrawals Work and Why Balance Management Matters
5 minutes to readExpertOption Reviews: An Honest Overview and Tips from Traders
5 minutes to readExpertOption Withdrawal Policy: How Withdrawals Work and Why Balance Management Matters
5 minutes to read